 Nederlands
  English
 Why Datafy combines different analysis methods
You can examine the contribution of marketing in several ways. A customer journey analysis shows which measurable touchpoints preceded a conversion. An econometric analysis looks at the relationship between media spend, sales and other factors over longer periods. Both perspectives provide information, and both also have blind spots.
Which question belongs to which analysis?
Attribution helps you follow the calculated contribution of channels and how that contribution develops. Sensitivity analysis examines how the outcome changes when the budget of one channel changes to a limited extent. Scenario analysis compares specific budget alternatives that have been calculated in full, including when several channels change at the same time.
| Method | Answers | What the outcome means |
|---|---|---|
| Attribution | Which channels contribute to your sales, and how is that contribution developing? | Attribution gives direction. On its own it is not yet an instruction to change the budget. |
| Sensitivity analysis | What happens to total sales if you raise or lower the budget of one channel by, for example, 10% while the other budgets stay the same? | This shows how strongly the outcome responds, according to the model, to a change in that specific channel. |
| Scenario analysis | What happens if you halve the TV budget and invest the freed-up budget in search? | The result does not give certainty about the future. It does give a well-founded comparison of your options. |
Two engines, one answer
What customer journeys can tell you
By analysing individual, observable touchpoints, you can examine how visits and conversions relate to campaigns. That is valuable for understanding the routes that lead to a purchase. Not every touchpoint is visible, though, and an observed sequence does not prove what would have happened without that ad.
What the econometric model adds
The econometric model studies how commercial results develop in relation to media pressure, season and available market factors, among other things. This makes it possible to examine effects that last longer and cannot be traced in a single customer journey.
Marginal Journey Simulation
Datafy calls the combination of these perspectives Marginal Journey Simulation. The underlying principle is that different sources of information together help you assess a budget decision.
The four steps form one cycle.
The two engines deliver analysis and interpretation, the weekly recommendation delivers the decision, and the validation delivers the evaluation. Together they form a closed loop that runs again every week, and improves itself.
How do we test the reliability of the model?
A calculation can fit the historical data well and still forecast poorly on new data. That is why it is important to compare forecasts with realised results afterwards and to examine forecasting quality outside the original estimation period as well.
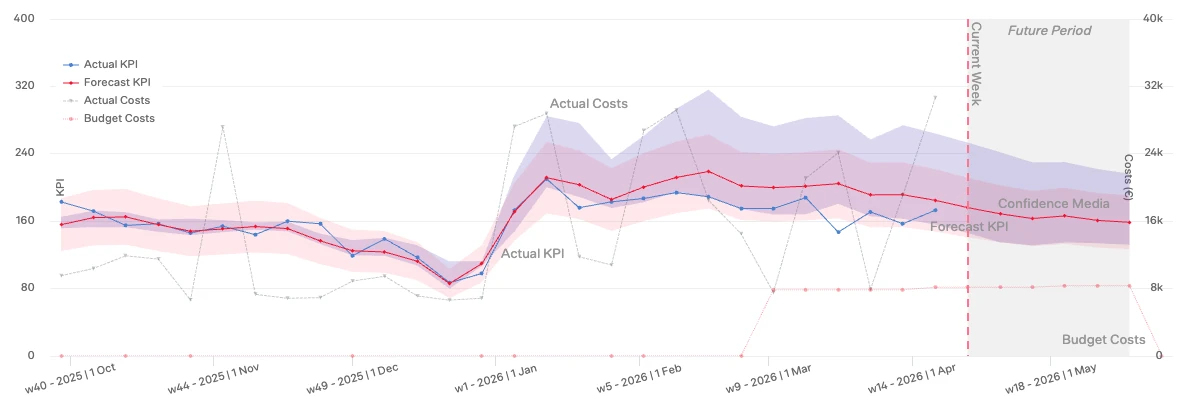
Forecast next to actuals, every week
The model predicts next week's revenue, and a week later places that prediction next to what actually happened. That test is visible to everyone in the platform, even when the outcome disappoints.
Tested on data the model never saw
Predictive power is assessed on periods held out of the model build, the standard from statistics that prevents a model from merely parroting the past.
Assumptions on the table
Every model rests on assumptions, ours included. Instead of hiding them, we write them out in our methodology note. That way your analytics team can assess them before you steer on the outcomes.
What uncertainty means for a decision
Not every channel effect can be estimated with the same precision. A sensitivity analysis or scenario should therefore make clear how much uncertainty the outcome contains, especially when you calculate far beyond previous budget levels.
Mathematical models for everyday marketing practice
Datafy was developed under the leadership of Dr. Auke Pot, who holds a PhD in mathematics (stochastics) from the Vrije Universiteit Amsterdam under Prof. Dr. Ger Koole. Customer journeys are stochastic processes and budget allocation is a mathematical optimisation problem, precisely the field in which he earned his doctorate. That background shapes the method: every calculation step in the platform is mathematically defined, every assumption explicit, and every result testable.
One design decision per article, defended by the founder
Every choice in Marginal Journey Simulation has a reason, and we explain it publicly. Three examples from the series:
Why marginal, not average
The average return answers an accounting question; the budget question is about the next euro. Why that difference shapes the entire model design.
Why we simulate customer journeys all-or-nothing
Counting a touchpoint half does not exist in reality. What happens when you simulate, per journey, what would have happened without that moment.
Why we estimate conservatively
A model that is too enthusiastic costs the client money. How the estimation choices prevent outliers in the data from taking over the recommendation.
Appears as a technical series on LinkedIn, follow Dr. Auke Pot or the Datafy company page.
The methodology note: the full story, signed
For the reader who wants to go further than this page: a technical note written by Dr. Pot, with the formal definition of marginal return, the model assumptions explicitly numbered, the validation approach and a comparison with common attribution and MMM methods. Written for your data scientist, usable in any RFP.
What is in it
The marginal-return definition and how it is calculated per customer journey · the assumptions, explicitly numbered · the weekly validation cycle · how the method relates to last-click, data-driven attribution and classic MMM.
Receive the note
Leave your email address and receive the methodology note as a PDF, together with an invitation to go through it in a 30 minute session with your analytics team.
Put our method next to what you use now
In a 30 minute demo we show on real data how the two engines arrive at one recommendation, and where our model hit or missed its own forecasts.